Mark’s Covid Tracker
Introduction
Django-based Covid Tracker presented with Bokeh Visualizations
This application is based on publicly available data from the Johns Hopkins University Center for Systems Science in Engineering. “Dong E, Du H, Gardner L. An interactive web-based dashboard to track COVID-19 in real time. Lancet Inf Dis. 20(5):533-534. doi: 10.1016/S1473-3099(20)30120-1”
Although this site publishes COVID data, it can be used as a template to display any kind of data. The creation of charts has been abstracted so that button filters are created based on a type of data. Work still must be done to import new data and display new charts, but the Django framework for delivery can easily be reused.
Example Visualizations
Each chart can be filtered using buttons and scrollbars at the left of each chart. All charts support rollover information.
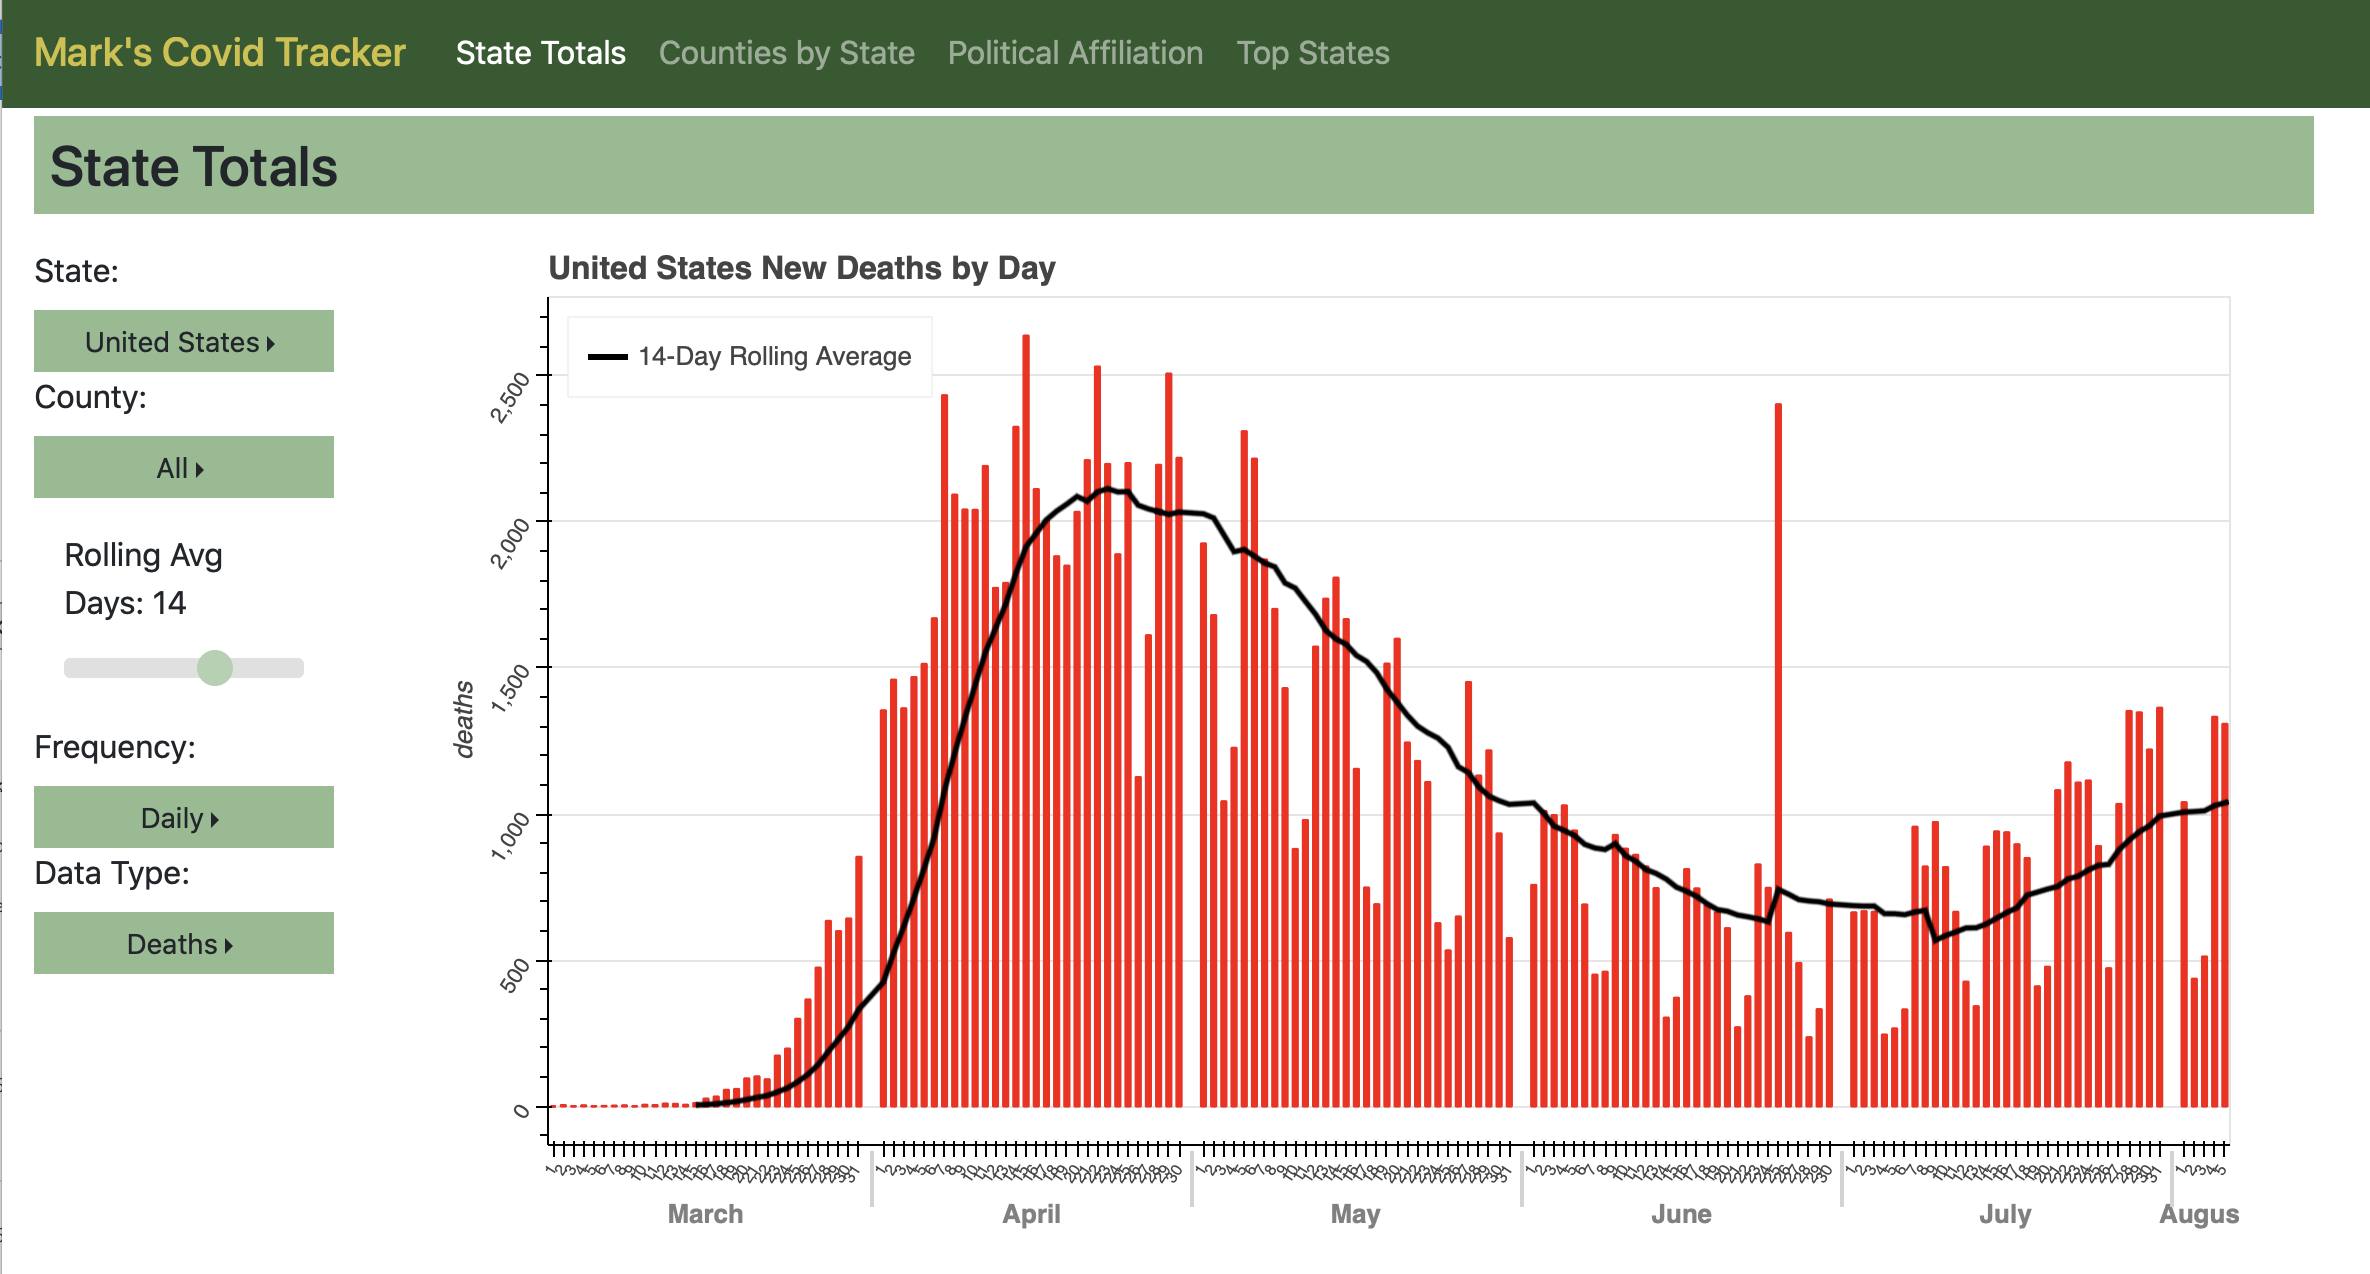
state totals
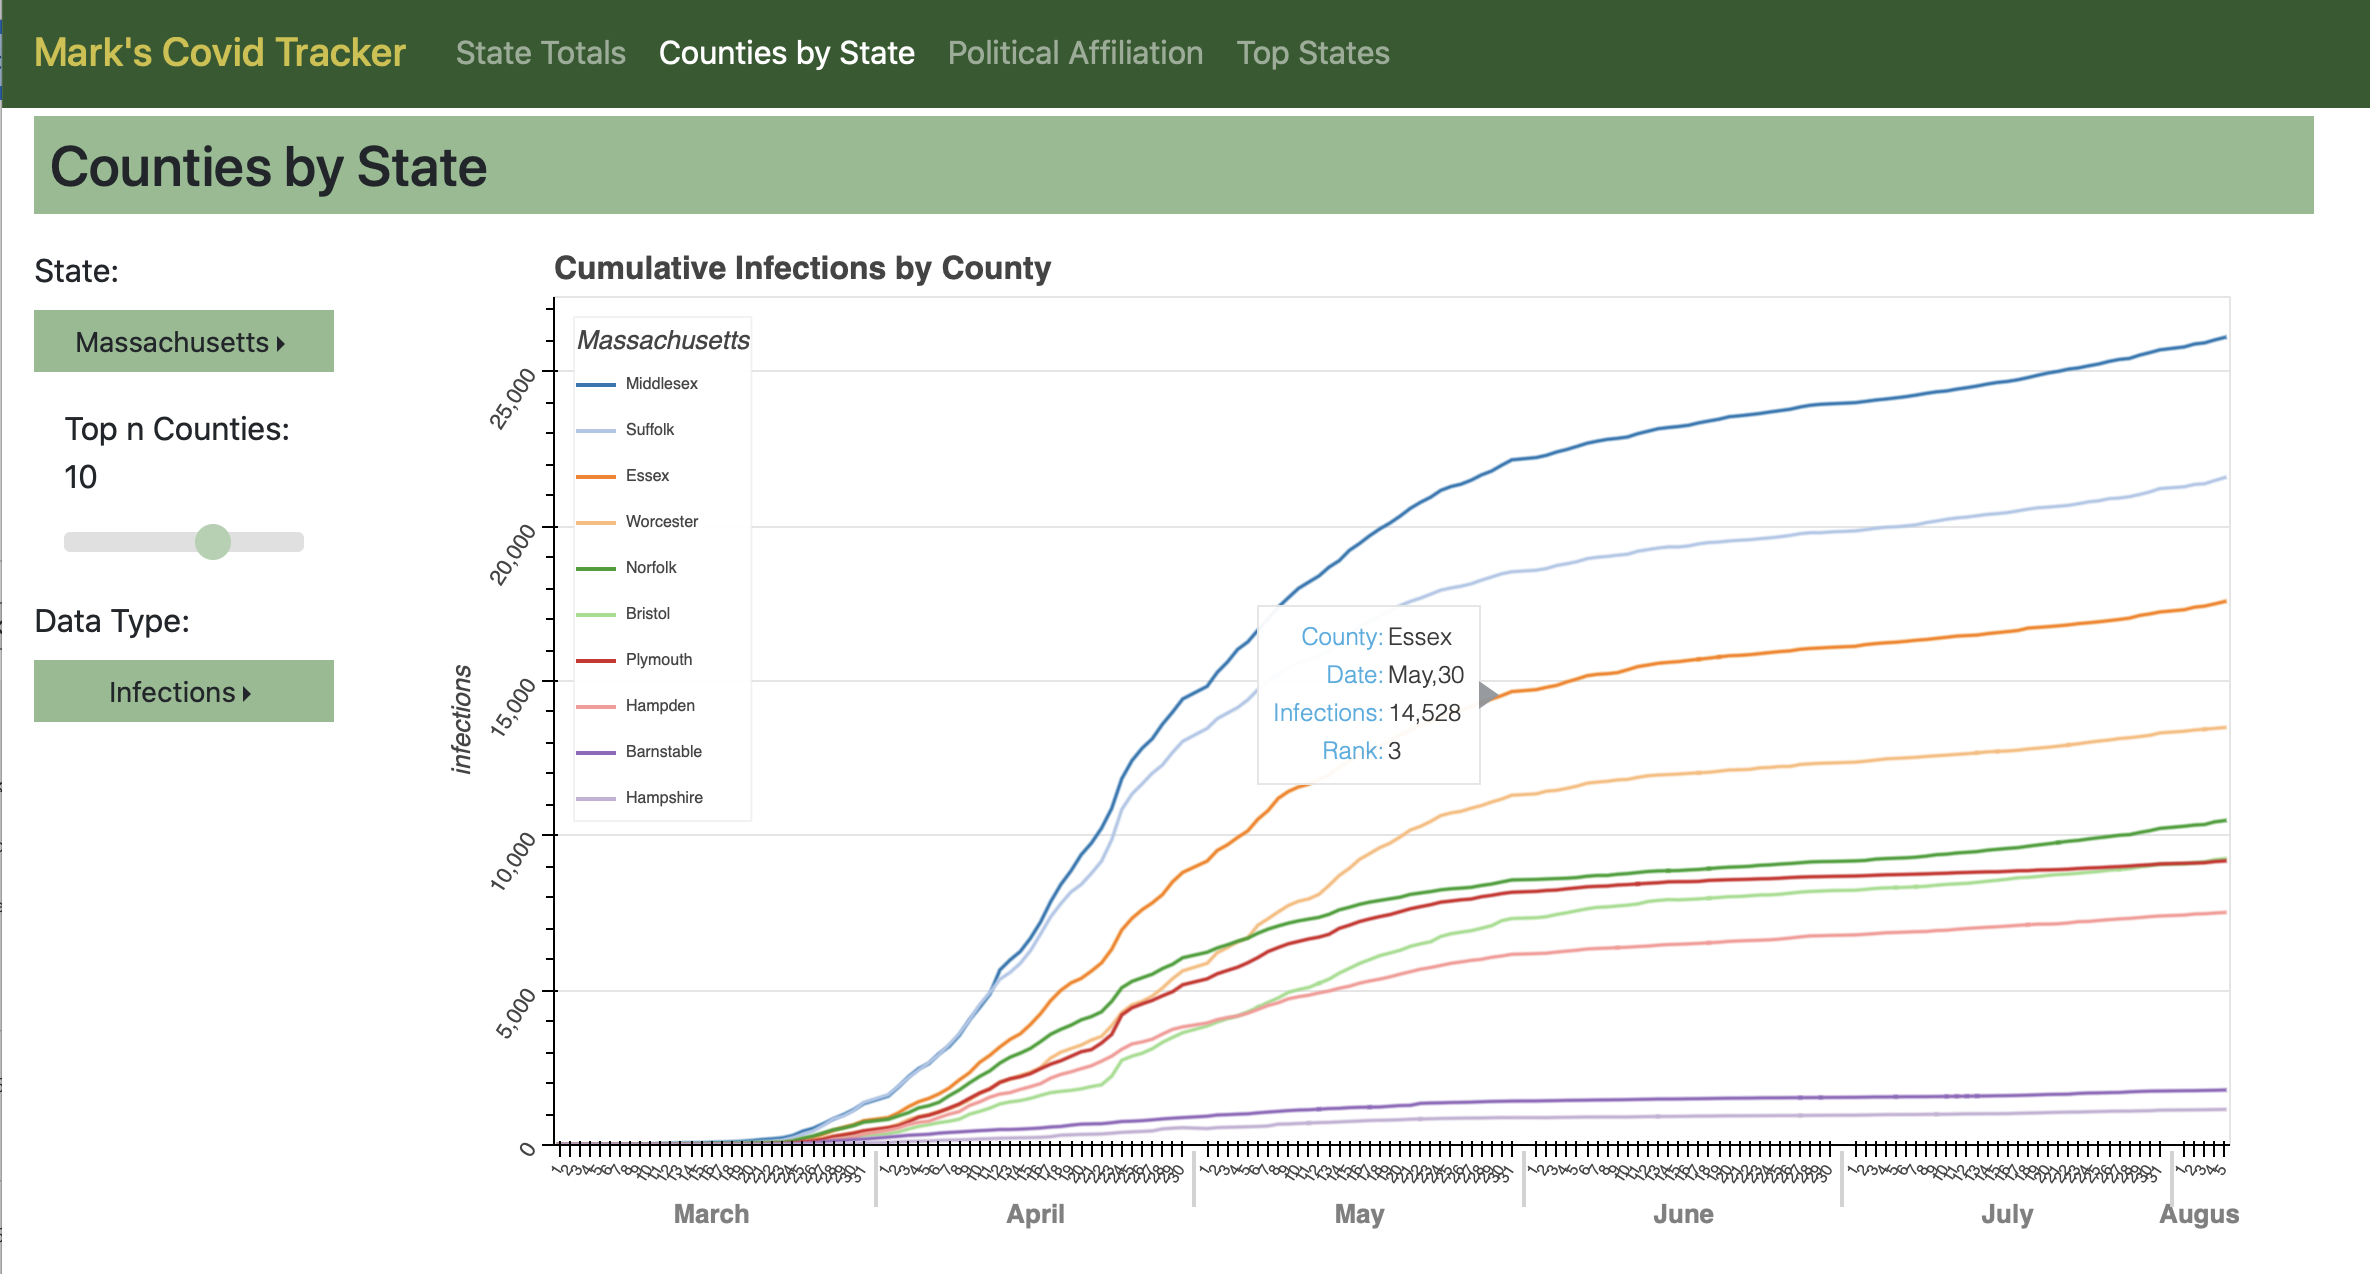
state totals
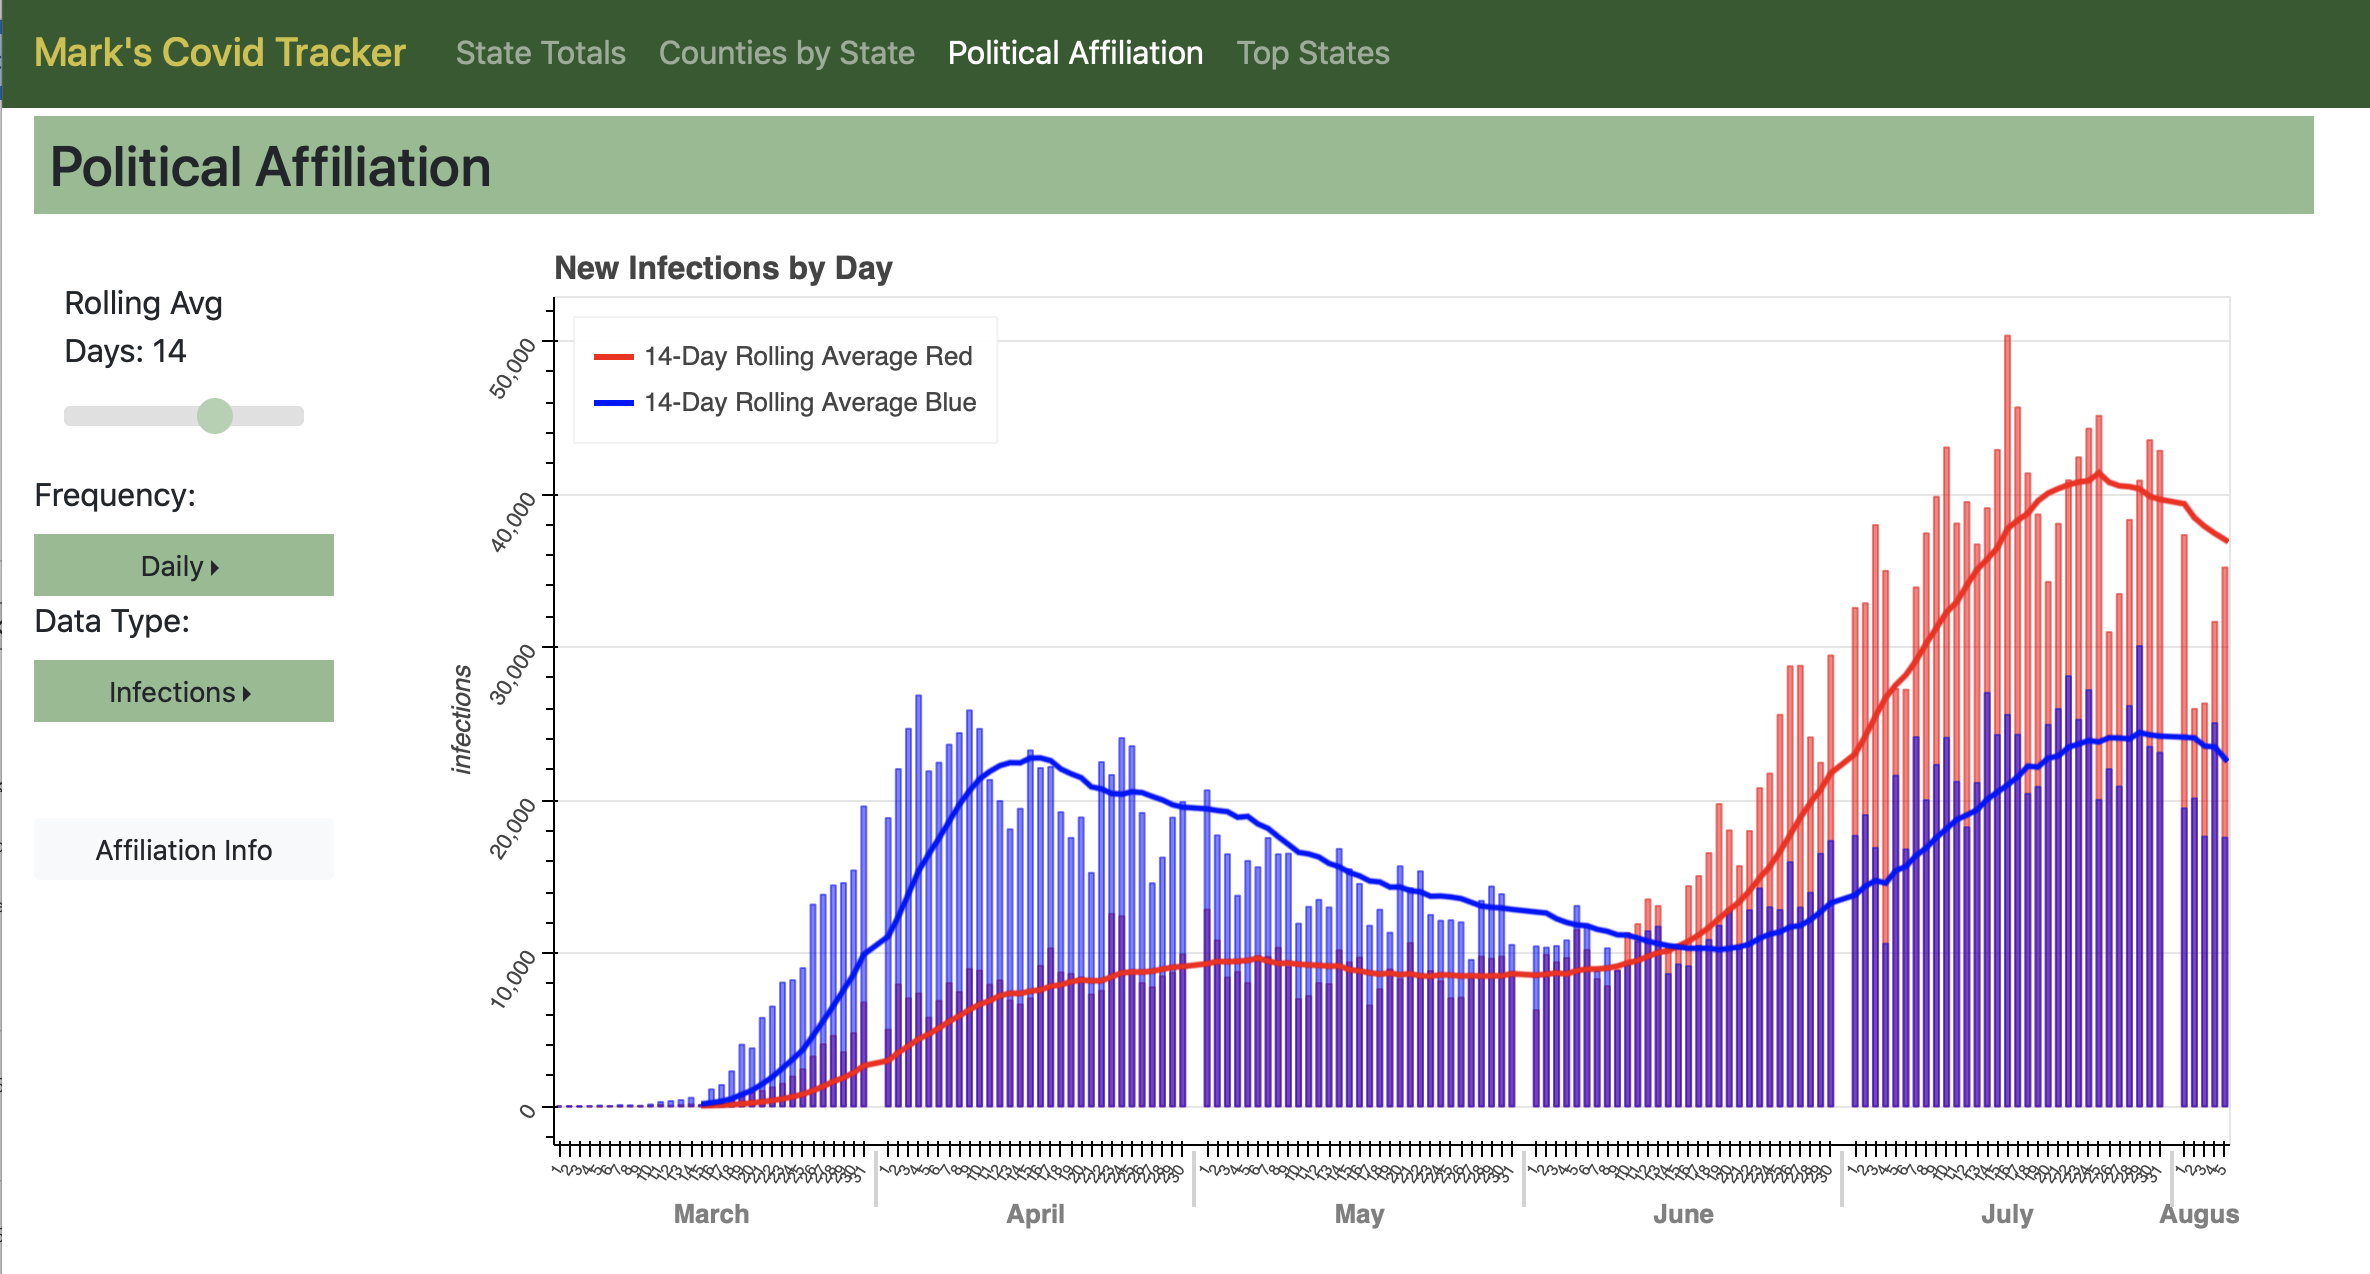
state totals
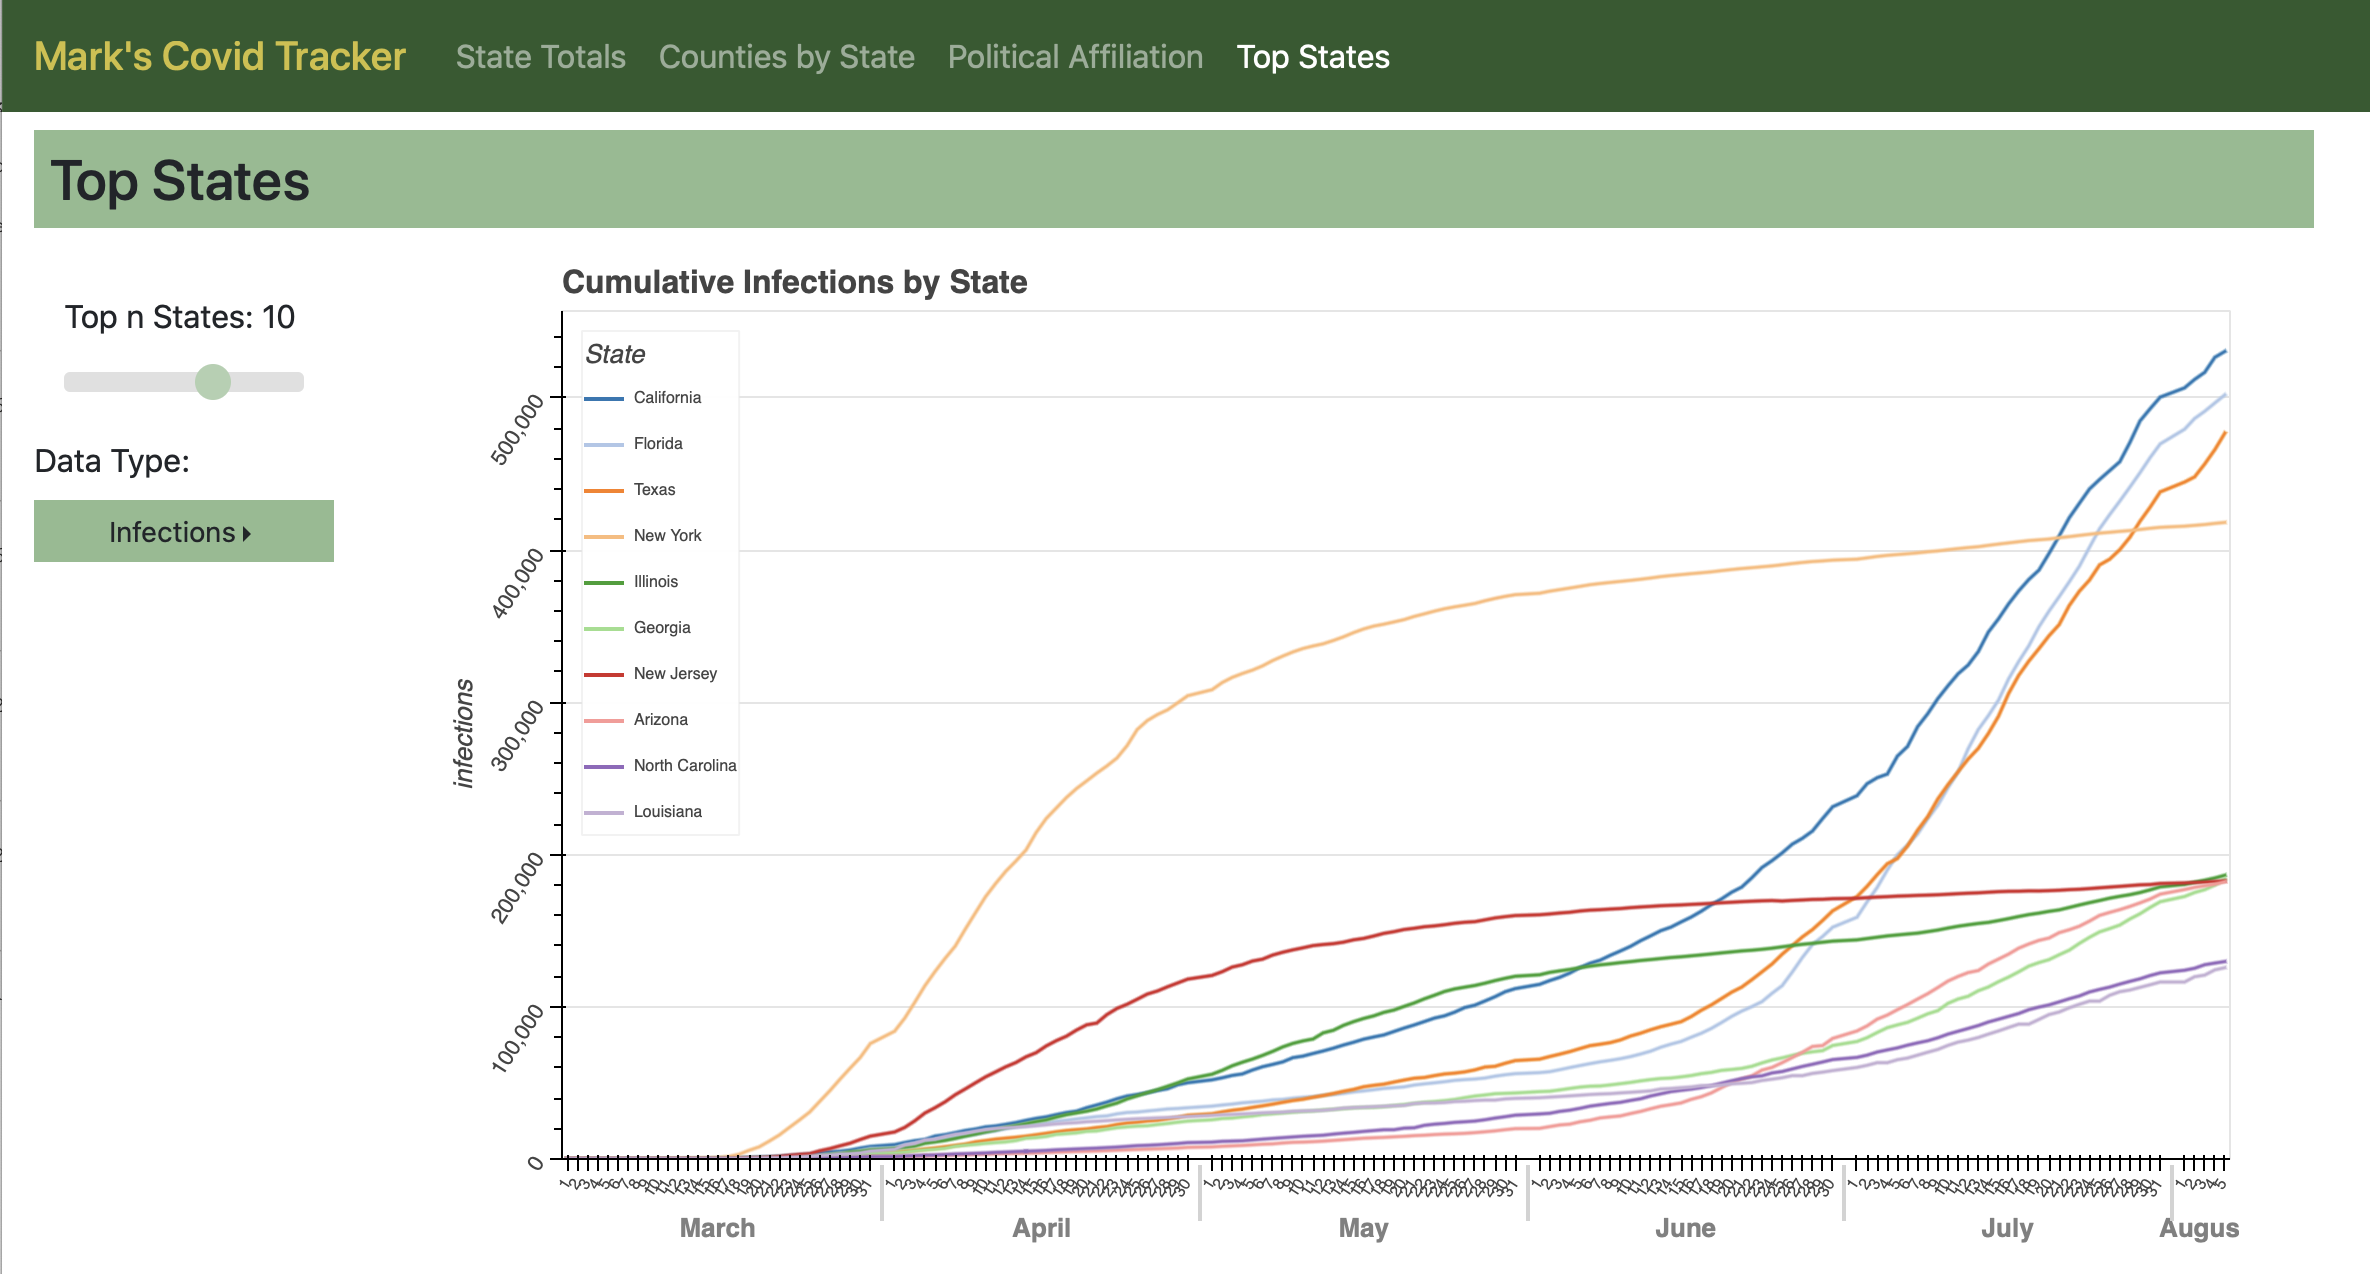
state totals
Application Architecture Summary
The application uses a Django web server to present various Bokeh visualizations of infection and death rates in the US by state, county and political affiliation. Javascript is used to put the visualizations on the html page. Interactions will call the Django server for an updated chart and insert it into the local page. Data is gathered from the John’s Hopkins GIT repo and is refreshed when the page is loaded.
Quick Start
To use the tracker locally:
Clone this repo
Install pipenv
pip install pipenv
Get a census application key (https://api.census.gov/data/key_signup.html)
Create a
.envfile in the root and add variables as described in the “Local Environment Variables” section below.Launch the pipenv virtual environment
pipenv shell
If running a production environment (
WORKSPACE=PROD), update the static files using
python manage.py collectstatic
Start the Django server from the
/tracker/trackerdirectory
python manage.py runserver
Local Environment Variables
Before the application can be executed locally, 3 local environment variables must be created.
1. DJANGO_SECRET_KEY: This can be anything you choose.
2. CENSUS_API_KEY: Get a key at https://api.census.gov/data/key_signup.html
3. WORKSPACE: PROD or
DEV. PROD will disable Django debugging and force the Docker
version of the application to execute within a WSGI wrapper.
Each of these variables must be created in a .env file saved in the
root folder.
Alternative Execution Methods
Once the local environment variables have been saved in a local .env
file, the application can be run natively from Django or can be packaged
as a Docker container. Alternatively, the application can be run using a
WSGI gunicorn wrapper.
Run from Django
To run from Django, navigate to the tracker/tracker directory:
python manage.py runserver
Django with a Web Server Gateway
Alternatively, the application can be run using gunicorn WSGI as well:
gunicorn --bind 0.0.0.0:8000 --workers 4 --timeout 600 tracker.wsgi
Docker
To use the application from a Docker container, an image must first be created. From the root:
docker build . -t covid_tracker
After the image is created, a container can be created and run:
docker run --rm --env-file ./.env -it -p 8080:8000 covid_tracker
The docker container can also be built and executed using docker-compose. Multiple processor architectures are supported.
For ARM (Mac Silicon):
docker-compose -f docker-compose_arm64.yml up --build
For Intel 64-bit processors:
docker-compose -f docker-compose_x86_64.yml up --build
After the initial build the --build switch is not necessary.
The site can be accessed locally at http://127.0.0.1:9000. The port can be change in the docker-compose_<architecture>.yml file. Where <architecture> is arm64 or x86_64.
Extending the Application
The application has been designed to be extensible and accommodate new visualizations. To do this, you will need familiarity with Python, Bokeh and Javascript.
Following the repo examples as a starting point is recommended.
To add new visualization:
Create bokeh visualization with a function accepts a request which has named variables their default values for the chart.
The code should be placed in the ‘views’ directory.
The function which creates the bokeh chart must include a request variable as the first argument.
ex: plot_mychart(request, color=’red’, animal=’frog’)
The plotting function must return a django.JsonResponse(bokeh.json_item(p)), where p is the bokeh plot.
The function can include variables in addition to the ‘request’, but the http nature of the application requires that variables are extracted from the ‘request’ object. See the other visualizations as an example.
Create javascript function to add control elements. See the
draw_covid_tracker()function in thecovid_js.jsscript for an example of how to place the bokeh chart into HTML.Update the
tracker/tracker/covid_tracker/urls.pyfile to include the new path. The path must match the path name created when updating thedraw_covid_tracker()function.
Serving Static Files in Production
For production, static files are centrally collected using
python manage.py collectstatic. This will store the static files
into a directory identified in settings as ‘STATIC_ROOT’. We then use
Whitenoise to serve the static files in production.
This configuration requires several new variables in the settings.py confuration under the static files section. This is handled in the docker-entrypoint.sh script when publishing using Docker but will need to be manually executed if running a production instance from Django.
Important: changes to static files under the app directory will require
you to run python manage.py collectstatic to update the centrally
managed static files.
Publishing to Azure
Before publishing to Azure, you will need an Azure account and need to login locally.
The following command will build an image and publish it to your Azure registry:
az acr build --image covid_tracker --registry {your_registry_name} --file Dockerfile .
Potential Improvements
Cache data on user-side for speed improvements
This may require building the of bokeh plots in JavaScript
Otherwise, the entire plot returned from Django can be cached
Put data into Postgres database
Use separate Docker container that will auto-refresh as needed
Warm-up takes long. Create a static site that will provide feedback to the user that application is loading.